A health system like DCH produces a staggering amount of data from a wide range of sources. Something like DCH’s COVID-19 daily update dashboard would usually take 90 or more days to develop and test. The Data Science Team (DST) at DCH delivered the initial version of the dashboard in about two weeks and has been adding to it and refining it ever since.
 Preparing data for advanced reporting like the dashboard is similar to an iceberg, noted Matt DeLaire, manager of Data Science. “In Data Science, 90 percent of the work is below the surface,” DeLaire said. This includes all of the data loads and validation, data definitions for the terms used in the dashboards, and setting up the automated transactions to add, edit and delete data. “The last 10 percent is the actual fun part of putting all of this into a visualization or graphic for the customer.”
Work on the initial dashboard began in March when the DST received data requests from several departments. For example, the Lab needed data for the testing that was happening at the DCH remote screening site.
Graph paper was used to map the dashboard’s prototype, which was based on the most commonly requested data, DeLaire explained. “I asked our team members to think like a hospital decision-maker in a pandemic crisis and deliver high-level graphical data representations to help drive decision-making.”
Additional Health System departments began requesting data related to COVID-19. The DST aimed to take these requests for multiple data files and spreadsheets and turn them “into meaningful information for understanding the crisis that was unfolding,” DeLaire said. The team also was focused on an automated tool not requiring daily human intervention, he noted.
The 10-member team divided into two -- one for operational type requests and one for advanced data visualizations.
Like any project team, challenges arose for the DST. To build the dashboard, it had to pull data from many different systems across DCH such as MEDITECH, Teletracking and Midas.
Another hurdle: The same data often exists across multiple departments. Ventilator data, for example, exists in Nursing, Respiratory Care and Finance.
Where the data is pulled from depends “on the decisions that are to be made from the data and which one makes the most sense,” DeLaire said. “Often times, subject matter experts from the areas not chosen will have slightly different numbers due to nuances in the system, usually centered around timing. So we have to spend a lot of time sorting out those discrepancies to build integrity in our data structures.”
The DST has met all of these challenges head on.
“These efforts are the direct result of many long days and evenings of work by the Data Science Team who has thrived in this fluid environment of teleworking. The team has really done a great job and has knocked it out of the park,” DeLaire said.
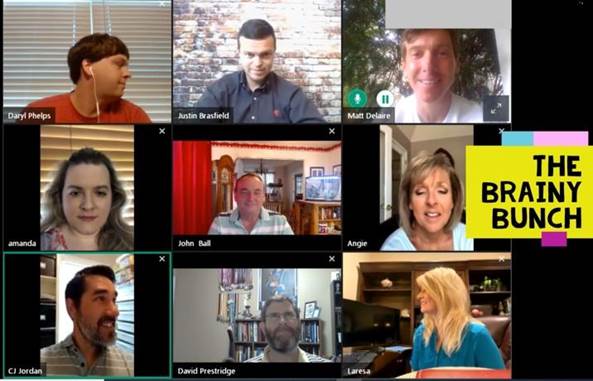
The DST is primarily working at home currently and regularly meeting via video conference. The format, see the photo, is visually reminiscent of a ‘70s TV show. Kudos to “The Brainy Bunch” for all the hard work behind the numbers.